
On wood samples, RAMAN spectroscopy was first applied in the 1980s (Agarwal and Atalla; 1986; Atalla and Agarwal; 1985). Recently, RAMAN spectroscopy has also been widely used to reveal differences of chemical composition of plant materials e. g. Agarwal et al. (2015); Agarwal (2014, 2006, 2005); Prats Mateu et al. (2016, 2014); Gierlinger et al. (2010); Gierlinger (2011); Gierlinger et al. (2012, 2013); Gierlinger (2014). RAMAN spectroscopy determines the chemical composition of plant cell walls and further specific properties – e. g. the cellulose micro fibril orientation (band integration 1098 cm-1) of wood fibres (Gierlinger et al.; 2010), S/G ratio (Sun et al.; 2011) as well as molecular changes after mechanical and chemical processing. In RAMAN spectroscopy, specific band positions in the spectra describe different functional groups, which are related to specific wood components.
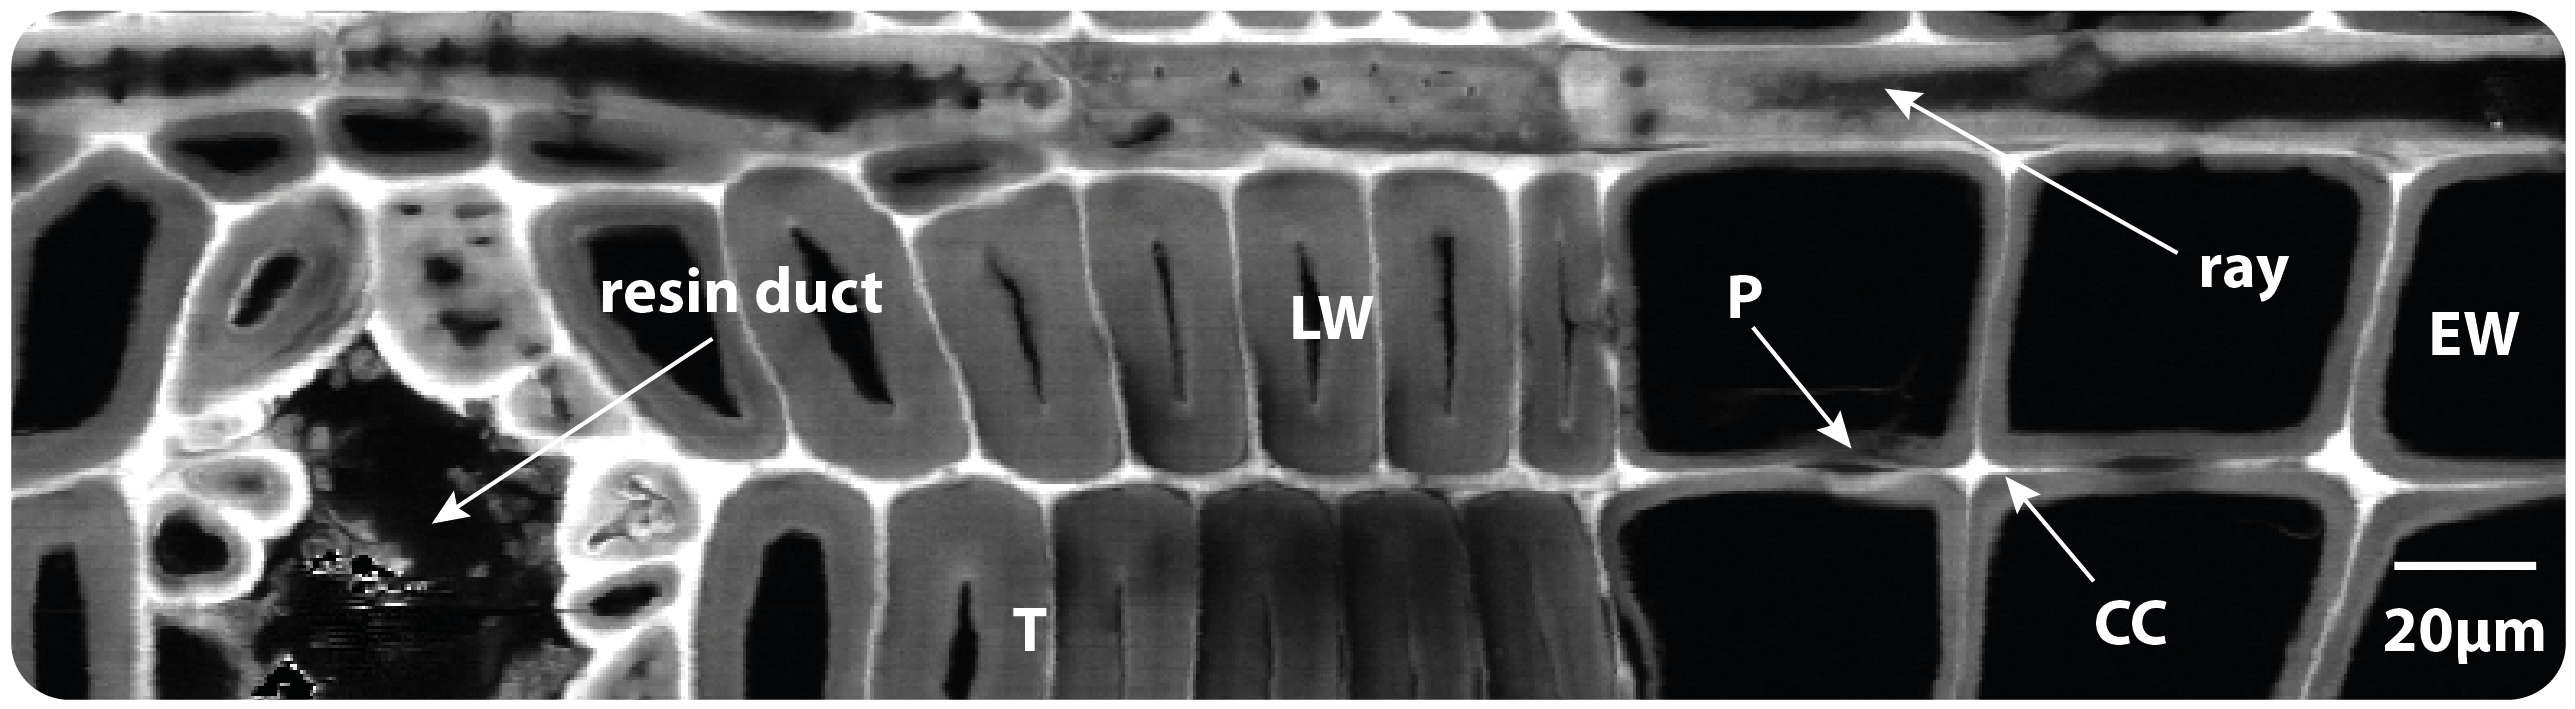
Figure 1 | High resolution RAMAN image based on the univariate approach (integration of specific bands): RAMAN image of spruce at the transition zone between the heartwood and sapwood boundary based on integration from 1550 to 1700 cm-1, the boundary between latewood (LW) and earlywood (EW) is in the middle. The resin in the resin canal, lignin in the cell corners (CC) and compound middle lamella (CML) show high intensity as well as pits (P) in EW.
Studying the morphological and topochemical changes in wood tissues by traditional methods such as sectioning of resin embedded samples or isolation of distinct tissues by chemical treatment (e. g. maceration) often do not reflect the native state of the sample. CRM in combination with fresh tissue sectioning is a non-destructive method with minimal sample preparation that visualizes the chemical distribution in context with the wood microstructure. Confocal RAMAN imaging allows to record spatial ordered RAMAN spectra on a sample which are used to build chemical images by integrating over specific bands. Band integration is a univariate approach which enables the visualization of different components in the wooden cell wall along the scanned area. Figure 1 shows an example for a chemical image of spruce wood which includes latewood, earlywood, radial ray as well as a resin duct. Wood constituents have marker bands for polysaccharides, lignin and other minor compounds (e. g. extracts, proteins, lipids). As example for the band integration in Figure 2, the water, lignin and cellulose distribution maps are shown. First, by integrating over the 3057-3657 cm-1range the high intensity in the lumen shows the free water in the lumen and the bound water in the cell wall. In the cell corners and middle lamella the intensity is lower, as these areas are mainly composed of lignin. This is confirmed when integrating over the 1600 cm-1, typical for phenolic rings (i. e. lignin or extractives) with compound middle lamella and cell corners highlighted as brighter areas. The cell wall is depicted in the last image based on integration of the 380 cm-1 peak, a skeletal vibration mode of cellulose (Wiley and Atalla; 1987). The intensity of each band can be used to determine the relative amount of each component in wood. However, by comparing molecules with similar chemical configuration as lignin and extractives, both with phenolic rings, it is difficult to distinguish between them and find characteristic bands to follow them separately (Fig. 1 resin duct compared with cell corner and middle lamella). Furthermore the extractives in wood represent a small proportion (depends on the species) and can thus be shadowed by the presence of lignin. This shadowing and overlapping effect also applies to cellulose and hemicellulose, being the latter very similar in composition but amorphous, with broader and less intense bands that makes the discrimination difficult. In addition, the overlapping of specific bands can also occur although corresponding to different functional groups (e. g. lignin 1453 (C-H3 deformation in O-CH3) and cellulose 1456cm-1 (HCH and HOC bending)).
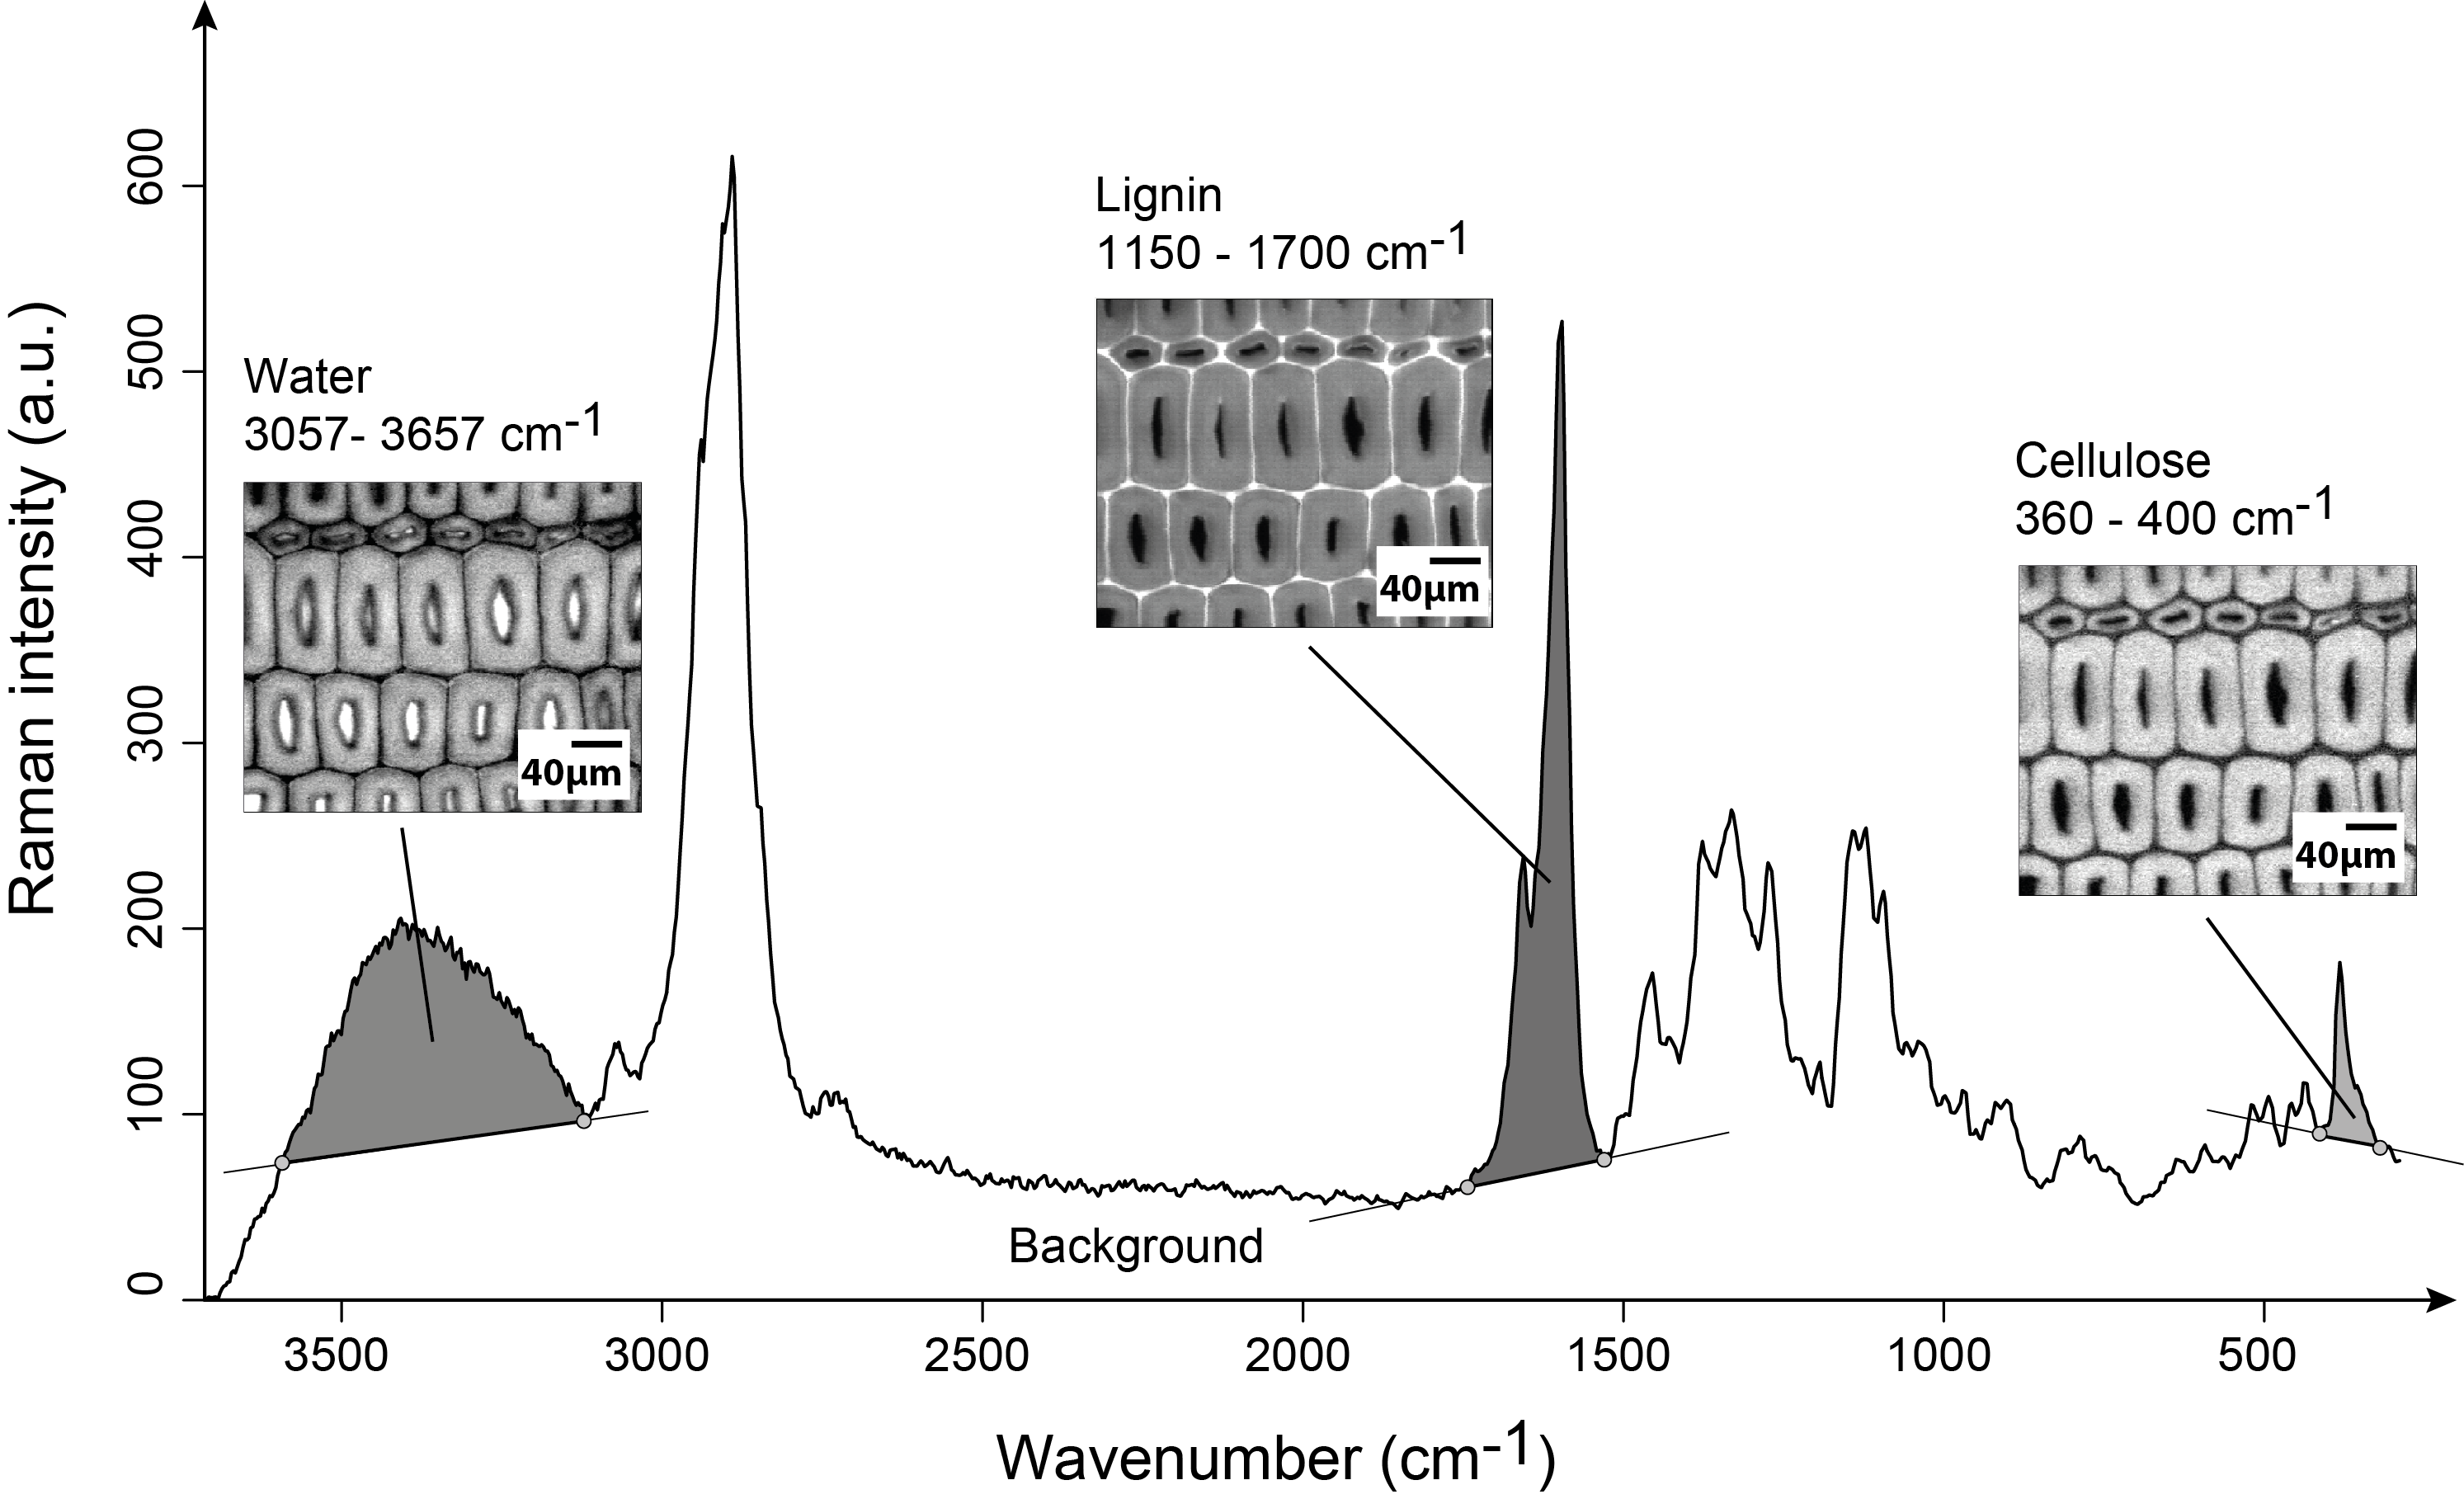
Figure 2 |Characteristic RAMAN spectra of spruce wood. The univariate approach gives, depending on the integration range (grey areas under the spectrum with baseline correction), different chemical images – e. g. the distribution of water, lignin and cellulose.
In the past, RAMAN spectroscopy was already used to study heartwood formation in pine Bergström et al. (1999); Bergström (2003); Gustafsson (2001). Composition from sapwood to heartwood was probed, however they have not applied RAMAN imaging to reveal the composition on the micron level in context with the anatomical wood structure. In the last years the knowledge gain out of the many acquired spectra acquired with the RAMAN imaging approach was improved by applyingmultivariate data analysis approaches (Fackler and Thygesen; 2012; Gierlinger; 2014; PratsMateu and Gierlinger; 2015; Felten et al.; 2015).